The Worst Cars Ever Made
That’s unfair to say, of course. I just said it so you’d keep reading. But if you’ve been paying attention to the 2026 Formula 1 season, you know there’s real controversy behind the clickbait- and when I started poking at it with math, what I found- well- prettty interesting I thought. So I’m here to share.
38ms. That’s the gap between two Formula 1 cars after six hundred meters of straight-line battle and a full 180-degree hairpin, as modeled by a simulation I built in Python. One driver had the aerodynamic advantage on the straight, the other clawed it all back through the corner, and after all that fury- the turbulent air, the mechanical screaming- they ended up separated by less time than a single frame of cinema film sits on the screen.
For years, the physics of trailing one F1 car behind another produced something bordering on the eerie: a near-perfect equilibrium between straight-line attack and cornering defense, a knife-edge so fine that overtaking came down to human skill, bravery, and the quality of a late-braking lunge. The car behind gained on the straights, the car ahead pulled back in the corners, and the whole violent negotiation hovered around zero-sum. That balance isn’t a coincidence. It’s a theorem. And it’s not just a model prediction- I validated it against 1,971 real overtakes pulled from four full seasons of F1 timing data. Nearly two thousand passes, 120 corners, 16 circuits, every unremarkable chicane and every famous hairpin.
The balance is real. It’s measurable. And the 2026 regulations just blew it to pieces.
Melbourne, March 2026. The season opener at Albert Park should have been a celebration: new cars, new rules, a new era. Instead, it was a circus. One hundred and twenty overtakes- nearly triple the count from the same race a year earlier. On paper, that sounds spectacular. In practice, many of them came from cars whose batteries simply died, drivers left defenseless on straights as their energy recovery systems flatlined, sitting ducks in two-hundred-mile-per-hour traffic. Max Verstappen’s battery drained on the formation lap. He hadn’t even started racing yet.
“Formula E on steroids,” Verstappen had called the new cars during pre-season testing, and the comparison was not a compliment.
Lando Norris was blunter. “We’ve come from the best cars ever made in Formula 1 and the nicest to drive,” he told reporters, “to probably the worst. It sucks.”
The regulations had promised better racing. The old Drag Reduction System- the adjustable rear wing flap that had been F1’s overtaking crutch since 2011- was gone, replaced by full active aerodynamics and something called Overtake Mode: a push-to-pass system that married movable bodywork to a burst of electrical energy. The idea was elegant. But the physics had other plans.
Here is the question that matters: not whether the racing is entertaining, but whether it’s real. Whether two drivers of equal skill, in equal cars, one attacking and one defending, actually have a fair fight. Whether the physics gives both of them a chance.
I built a model to find out. I simulated every meaningful variable across a representative straight-and-corner sequence, then threw the real world at it: four seasons of timing data, a quarter million close-following observations, every overtake I could extract. The question was simple- when the arithmetic settles, who’s ahead, and by how much?
To understand what 2026 destroyed, you first need to understand what existed before it.
Two Advantages, One Corner
Here is the simplest overtake in Formula 1. Two cars, one straight, one hairpin. That’s it. That’s the whole universe for right now.
The trailing car tucks into the leader’s slipstream around the 200-meter mark. At that distance, the leading car punches a hole through the air and the follower slips through behind it- shedding between 20 and 50 percent of its aerodynamic drag. By the end of a 600-meter straight, the leader has accelerated from 290 km/h to roughly 331. The trailer reaches 349. Eighteen kilometers per hour of free speed in the model; in practice, at real racing distances, the drafting advantage alone is closer to 4 km/h, roughly 13 with DRS.
That is the first advantage: speed, born from aerodynamics.
Now watch the leader. She knows the pass is coming, so she takes the wide line. The geometric reason is ironclad- and honestly kind of beautiful in its simplicity: a wider arc lets you carry more speed through the apex. Through this hairpin, the leader’s sweeping arc allows roughly 77 km/h at the clipping point. The attacker, diving to the inside, is pinched onto a tighter radius. The inside line yields about 68 km/h. Nine kilometers per hour slower, through the same corner, on the same asphalt.
That is the second advantage: line, born from geometry.
Two completely different physical phenomena- owned by two different cars- colliding in the space of a single braking zone. Right? Like just sit with that for a second.
On the approach straight, the slipstream does its work. But the moment both drivers stamp on the brakes, the attacker discovers the cost. She is carrying more speed and must slow to a lower cornering velocity: a double penalty. She brakes for 364 milliseconds longer than the leader. But here- and this is the part that made me do a double take- the physics offers a quiet gift: the faster you’re going, the less each additional km/h costs you in braking time. A diminishing-returns curve that quietly protects the attacker.
Then the hairpin itself. The inside line is slower, yes. But it is also shorter. The leader’s wide arc traces roughly 97 meters of tarmac. The attacker’s inside dive covers just 76. Twenty-one fewer meters of road. Even at 9 km/h less speed, those 21 meters are worth 524 milliseconds- more than enough to overpower the braking penalty. On exit, the leader’s superior corner speed reasserts itself, clawing back 123 milliseconds before the next braking zone.
Add it up. The slipstream gives. The braking zone takes. The short inside line gives back more. The exit takes again. 524 milliseconds gained, 364 lost in braking, 123 lost on exit. Net: 37 milliseconds. Call it 38 with rounding.
After 600 meters of straight-line battle and a full 180-degree hairpin- all that chaos and fury and tire smoke- the two cars are separated by less time than a single frame of cinema film sits on the screen. I mean come on.
The Theorem Nobody Expected, Wanted, or Cares About
Imagine a dial. Turn it all the way left: zero slipstream. The trailing car gets no draft whatsoever. The leader wins every time, cornering speed and racing line doing all her work. The time ratio sits below one.
Crank it all the way right: maximum slipstream. The trailing car arrives at the braking zone carrying so much extra velocity that the overtake gains time. The ratio climbs above one.
As you sweep that dial from left to right, the time ratio doesn’t jump or stutter. It rises smoothly, continuously. And a continuous curve that starts below a line and ends above it must cross that line somewhere.
That’s it. The intermediate value theorem, a piece of mathematics so elementary it lives in the first month of calculus. Essentially, we have a situation where we can guarantee there is a perfect spot for “fairness” so-to-speak.
The theorem doesn’t care about your track. Monza’s Variante del Rettifilo, Bahrain’s Turn 1, a hairpin sketched on a napkin: each one has a balance point hiding somewhere along that dial.
What the theorem cannot tell you is where real racing lives on that dial. That is an empirical question- and it’s one I can now answer with data, not just theory. I threw nearly 2,000 real overtakes at this framework across four seasons and 16 circuits. To find the answer, you need one specific number.
One Number to Rule Them All
I tested everything: straight length, corner radius, track width, speed differential at the braking point, DRS zone length. Every geometric and kinematic variable I could extract from overtaking zones across Formula 1 circuits. Just- all of it. Threw the whole kitchen at this thing.
One ratio outperformed them all.
Take the length of the preceding straight. Divide it by the radius of the corner at the end. L/R. A pure ratio with no units- the same type of number as Mach number (which tells you when you’ve broken the sound barrier). L/R tells you whether an overtake is going to stick.
I pulled four full seasons of F1 timing data (2022-2025) through FastF1 and programmatically extracted nearly 2,000 overtakes from 77 race sessions. I measured success rates at all 120 corners across 16 circuits- not just the famous ones- but every unremarkable mid-speed kink and chicane that rarely makes the highlight reel. I catalogued 803,140 close-following events- with the help of AI of course. Who also made this plot below, with a title I do not approve of. I willl leave it as a cautionary tale of letting Claude make plots for you (I’m kidding).
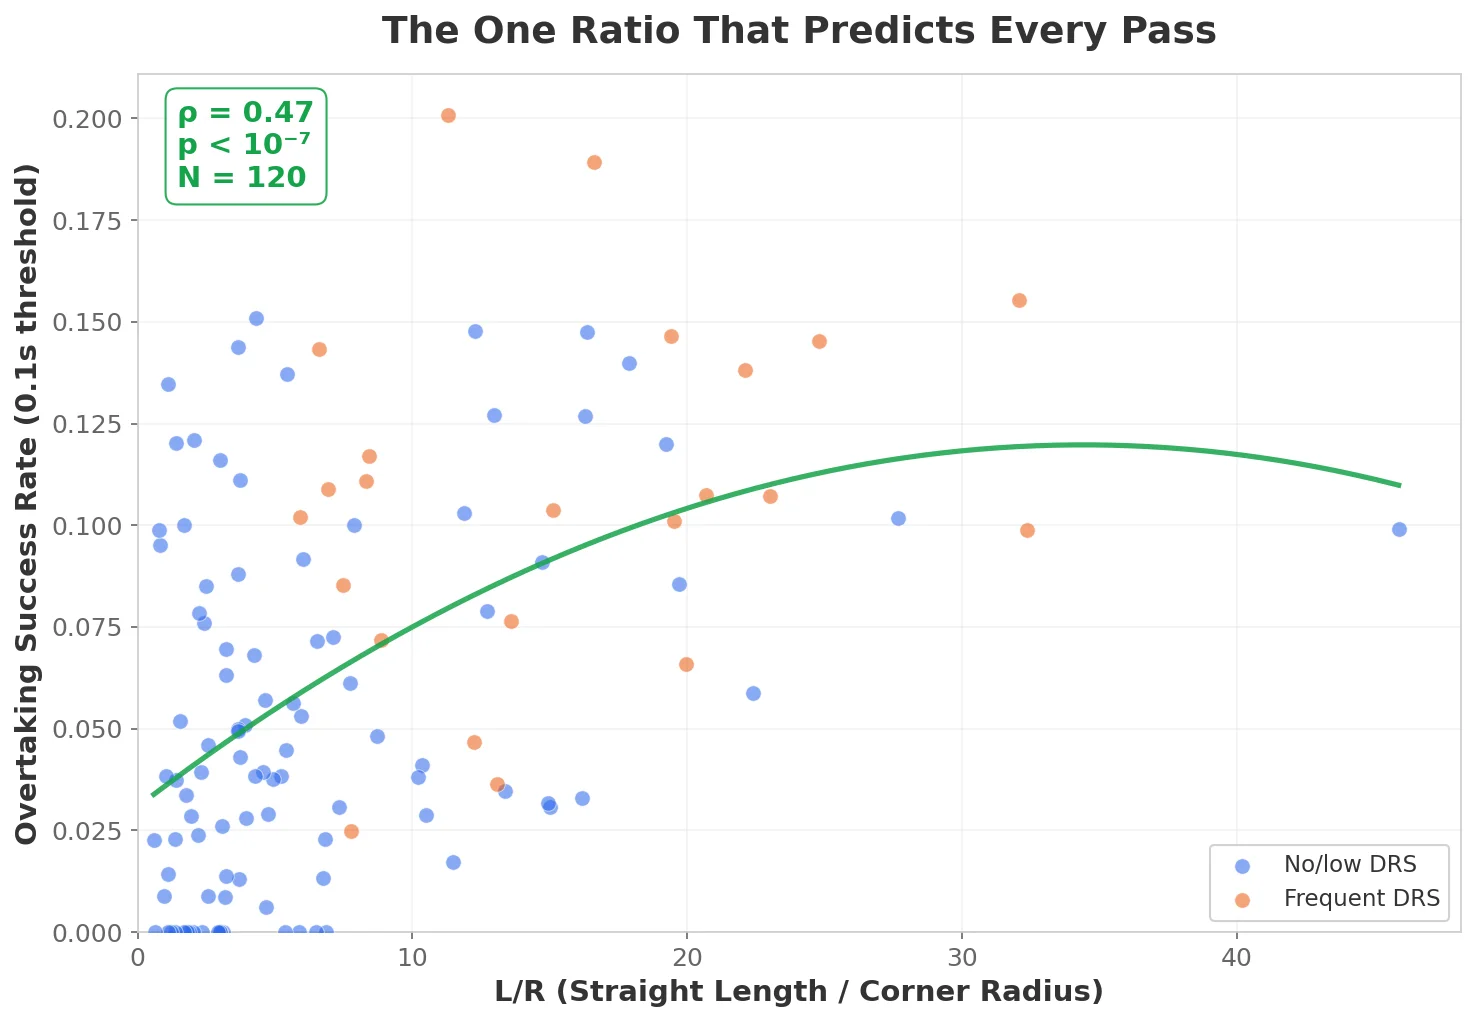
Each dot is a real F1 corner. Blue = corners without much DRS activity, orange = DRS-heavy zones. The green curve is the trend. Higher L/R, more passes stick.
And when I switched the y-axis from success rate to raw overtakes per race- the correlation got even stronger. Rho = 0.65. That’s not just “does the pass work when you try it”- it’s “do cars even show up close enough to try.” L/R predicts both.
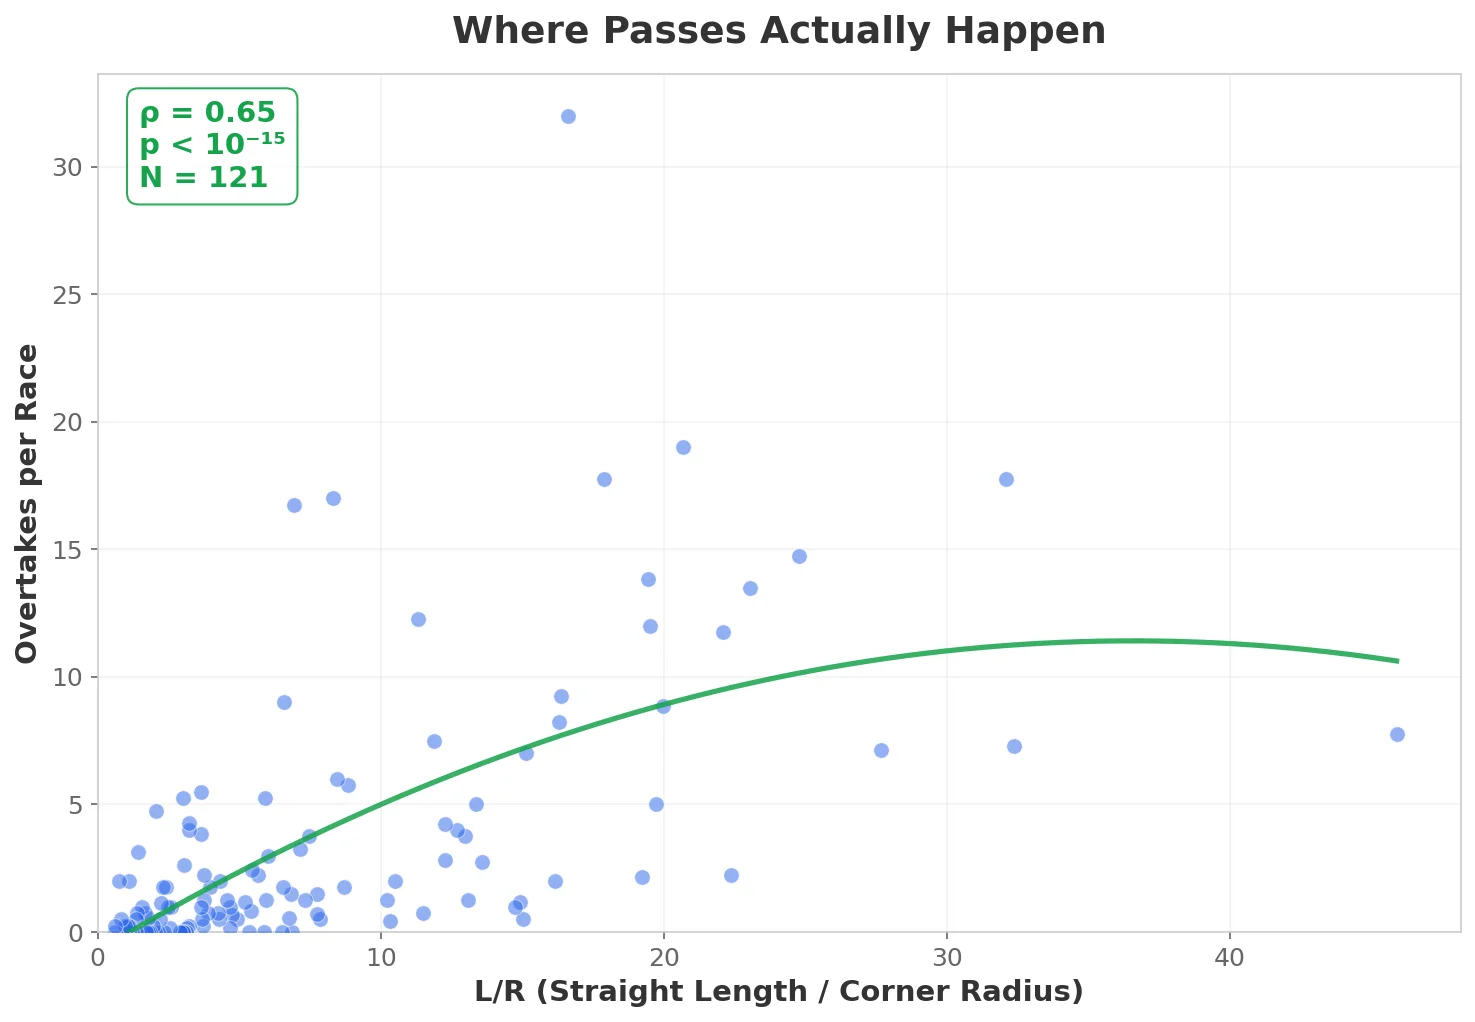
Same corners, different question. L/R doesn’t just predict whether a pass succeeds- it predicts whether anyone even attempts one.
I ran event-level logistic regression- a statistical model that predicts whether a pass succeeds or fails based on multiple variables at once- on 247,813 individual close-following observations, controlling for DRS availability, gap distance, all the confounders you’d want to throw at it. L/R was significant at p below 10 to the negative sixteenth.
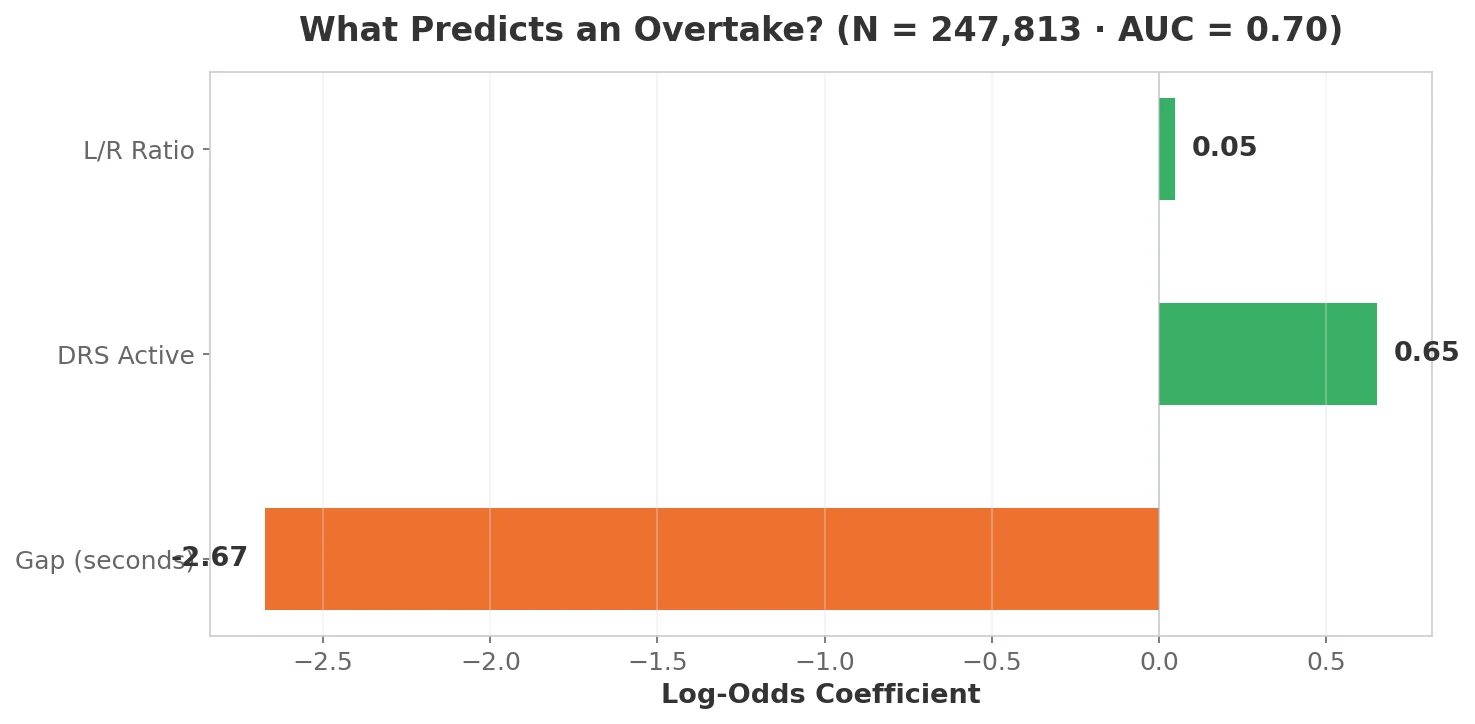
The three things that matter most in a quarter-million observations. Gap is king (get close or go home), DRS nearly doubles your odds, and L/R quietly governs which corners produce passes at all.
I tried every close-following threshold from 0.1 to 1.0 seconds; the correlation barely moved. I ran leave-one-circuit-out cross-validation; rho stayed between 0.44 and 0.51 no matter which circuit I dropped.
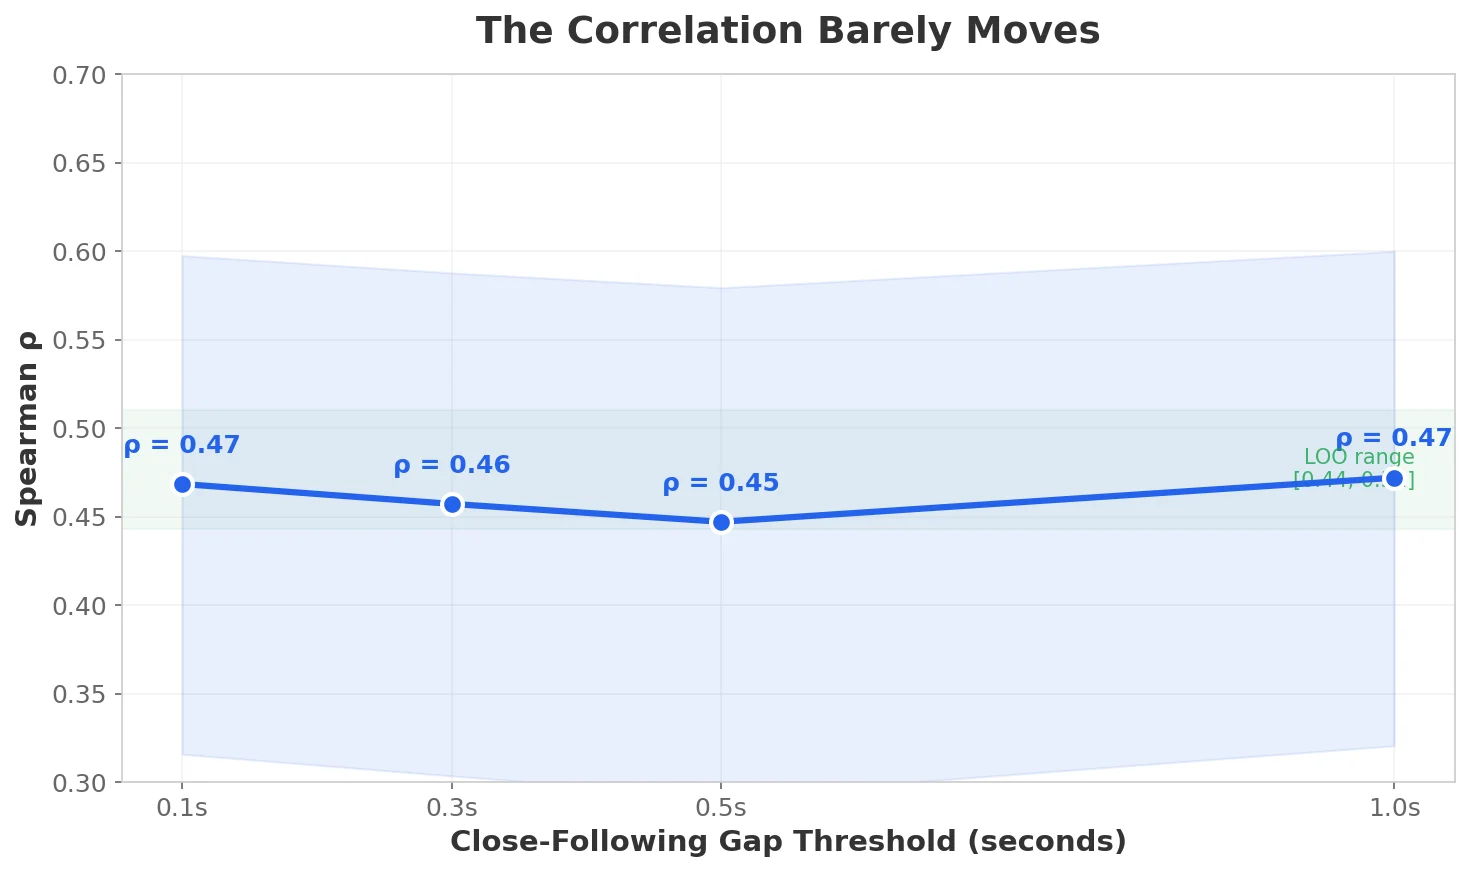
Change the definition of “close following” by 10x and the correlation moves by 0.02. The green band is the leave-one-circuit-out range- drop any circuit and the result holds.
The logic is physical. A long straight gives the trailing car more time to build a speed advantage. A tight corner demands heavy braking- which opens a wider window for a late dive. Long straight, tight corner: high L/R, high success. Short straight, sweeping bend: low L/R, the defender holds. Which- for anyone who has messed around in racing video games can tell you thats pretty intuitive.
Suzuka’s hairpin sits at L/R of 8. Success rate: 22 percent. Baku’s Turn 1 sits at L/R of 79- success rate 58 percent- because a two-kilometer blast down the Caspian seafront feeds into a tight left-hander where even a cautious dive has room to work. The geometry just… tells you.
A single dimensionless ratio, measurable from a satellite photo, showed up as a significant predictor in a quarter-million-observation logistic regression that controlled for everything I could think of. The details are wrong. The structure is right.
The L/R ratio explains the geometry. But geometry alone didn’t produce the racing F1 had.
Dig into the full dataset yourself- every corner, every circuit, every overtake across four seasons. Filter by track, toggle DRS, and watch the L/R ratio do its thing:
Interactive F1 Overtaking Explorer Filter by track, toggle DRS, and watch the L/R ratio do its thing across four seasons of data. Launch interactive →The Machine That Kept the Balance
Physics set the table. The FIA kept the plates from sliding off.
For decades, the FIA operated as a regulatory thermostat- adjusting aero rules, tweaking car weights, lengthening and shortening DRS zones circuit by circuit- all to keep the overtaking game balanced on its knife-edge. The goal was never to eliminate the defender’s advantage. It was to keep that advantage survivable. And honestly? They were reallyyy good at it. Like- surprisingly good at it- for a governing body that sometimes seems allergic to good decisions.
The masterwork was DRS. Introduced in 2011, the Drag Reduction System was breathtakingly simple: a flap in the rear wing that, when opened, cut drag for the trailing car and only the trailing car. The leader got nothing. The chaser, already pulling close through the slipstream, got a targeted shove.
Without DRS, drafting gave roughly 4 km/h of extra speed- real but often not enough to complete a pass. With DRS, that jumped to approximately 13 km/h. A near-tripling of the effective straight-line advantage.
What made DRS elegant was the counterbalance it preserved. The trailing car gained on the straight, yes. But the leading car still owned the corners- where clean air and the geometric privilege of the racing line clawed back time. Attack answered by defense. The ancient duel, recalibrated for the aerodynamic age.
And then 2026 threw it all away.
What 2026 Broke
Okay so the 2026 regulations changed four things simultaneously. Each one alone would have reshaped how cars pass each other. Together- and this is the part that keeps me up at night- they dismantled the overtaking equation that had governed Formula 1 for over a decade.
First: DRS died. It was replaced by active aerodynamics. Both front and rear wings now feature moveable elements that open and close like Venetian blinds: X-Mode on straights to cut drag, Z-Mode through corners for maximum downforce. The critical difference is that every car runs active aero on every straight, regardless of position. The trailing car no longer gets a tool the leader doesn’t have. The asymmetric advantage that powered a generation of passes- just- poof. Gone.
Second: Overtake Mode replaced DRS. When within one second of the car ahead, a driver can deploy an additional burst of electrical energy- roughly 0.5 megajoules drawn from the MGU-K’s (Motor Generator Unit-Kinetic, the car’s electric motor) full 350-kilowatt output. This sounds like DRS with a different power source. It is not. DRS was aerodynamic, essentially free, and reset every lap. Overtake Mode draws from a battery the car needs for the remaining corners, the next straight, the rest of the race. Every attack costs something downstream. Every. Single. One.
Third: the battery became the car. The MGU-K’s output tripled, from 120 to 350 kilowatts. The electric motor now produces nearly as much power as the combustion engine. And when the battery depletes- and this is the truly wild part- cars lose roughly half their total power. Engineers call it “clipping.” Spectators see a car that was doing 340 km/h on one lap hitting 290 on the next- visibly decelerating down the same straight- the driver a passenger to thermodynamics. Just sitting there. Watching cars go by.
Fourth: thirty percent less downforce. The sculpted ground-effect tunnels of the 2022 era gave way to flatter floors. The upside: less turbulent air behind each car, making close following easier. The cost: substantially less total grip. Late-braking lunges- the currency of the inside-dive pass- became more precarious.
The combined effect produces something that needs a name. Call it the phantom slipstream. Under the old rules, the speed differential between leader and trailer was aerodynamic- a predictable function of following distance. Under 2026, the leading car might be harvesting energy and deliberately shedding 50 km/h, while the trailing car deploys full battery power. A closing speed of 30 to 50 km/h that looks like a slipstream pass but has nothing to do with aerodynamics.
This is why Melbourne produced 120 overtakes. Many of them were not the two-advantage collision the model describes. They were one car running out of battery while another still had charge. That’s not racing. That’s a spreadsheet.
George Russell’s pole lap in the first race of the new era was 3.4 seconds slower than Norris’s 2025 pole at the same circuit. The cars are dramatically slower, and the gaps between them are dramatically wider.
But the deepest problem isn’t speed differentials or battery depletion. It’s that the new rules create a fundamentally different kind of overtaking.
See for yourself how the 2026 energy systems interact. This simulator lets you run two cars through a circuit with the new Overtake Mode, active aero, and battery depletion- watch the phantom slipstream in action:
Interactive F1 2026 Simulator Run two cars through a circuit with Overtake Mode, active aero, and battery depletion- watch the phantom slipstream in action. Launch interactive →Two Kinds of Passing
Let’s make up two kinds of passes you can observe in the current F1 season. These passes require different skills.
The first is a grip-limit pass. The attacker tucks in behind the leading car through a fast corner- fighting turbulent air that wants to rip the front axle loose. They hold on anyway: braking later, committing harder, threading a tighter line into the next bend. They pull alongside under braking, and for a few hundred meters two cars occupy the space that physics would prefer to give to one. The pass is resolved by who has more feel in their fingertips, more trust in their front tires, more willingness to dance at the adhesion limit. Both drivers are tested on the same fundamental skill. That’s the good stuff. That’s what we tune in for.
The second is a battery pass. The attacker deploys stored electrical energy on a straight. The advantage has nothing to do with aerodynamic proximity, braking precision, or cornering commitment. The leading car’s energy depletes, it slows by fifty kilometers per hour, and the trailing car sails past at full power. The pass was over before the braking zone arrived. The attacker didn’t need to be brave. They needed to have charge.
My expanded dataset- 1,971 overtakes across four seasons- lets me test the two-kinds hypothesis directly by stratifying on DRS. When DRS is not active, the pass has to be earned through physics: slipstream, proximity, commitment. Across those 120 corners, L/R predicts success beautifully (Spearman rho = 0.39, p < 10 to the minus fifth). Geometry and car control decide. But when DRS is active- the artificial speed boost switched on- L/R loses its predictive power entirely (rho = 0.13, not significant, N = 35). The regulatory mechanism overwhelms the geometric contest.
That’s the empirical fingerprint of two different sports hiding inside the same race. When the speed differential comes from physics- from drafting, from driving, from being genuinely faster- geometry governs the outcome. When it comes from a button, geometry becomes secondary. The distinction isn’t rhetoric. It’s measurable.
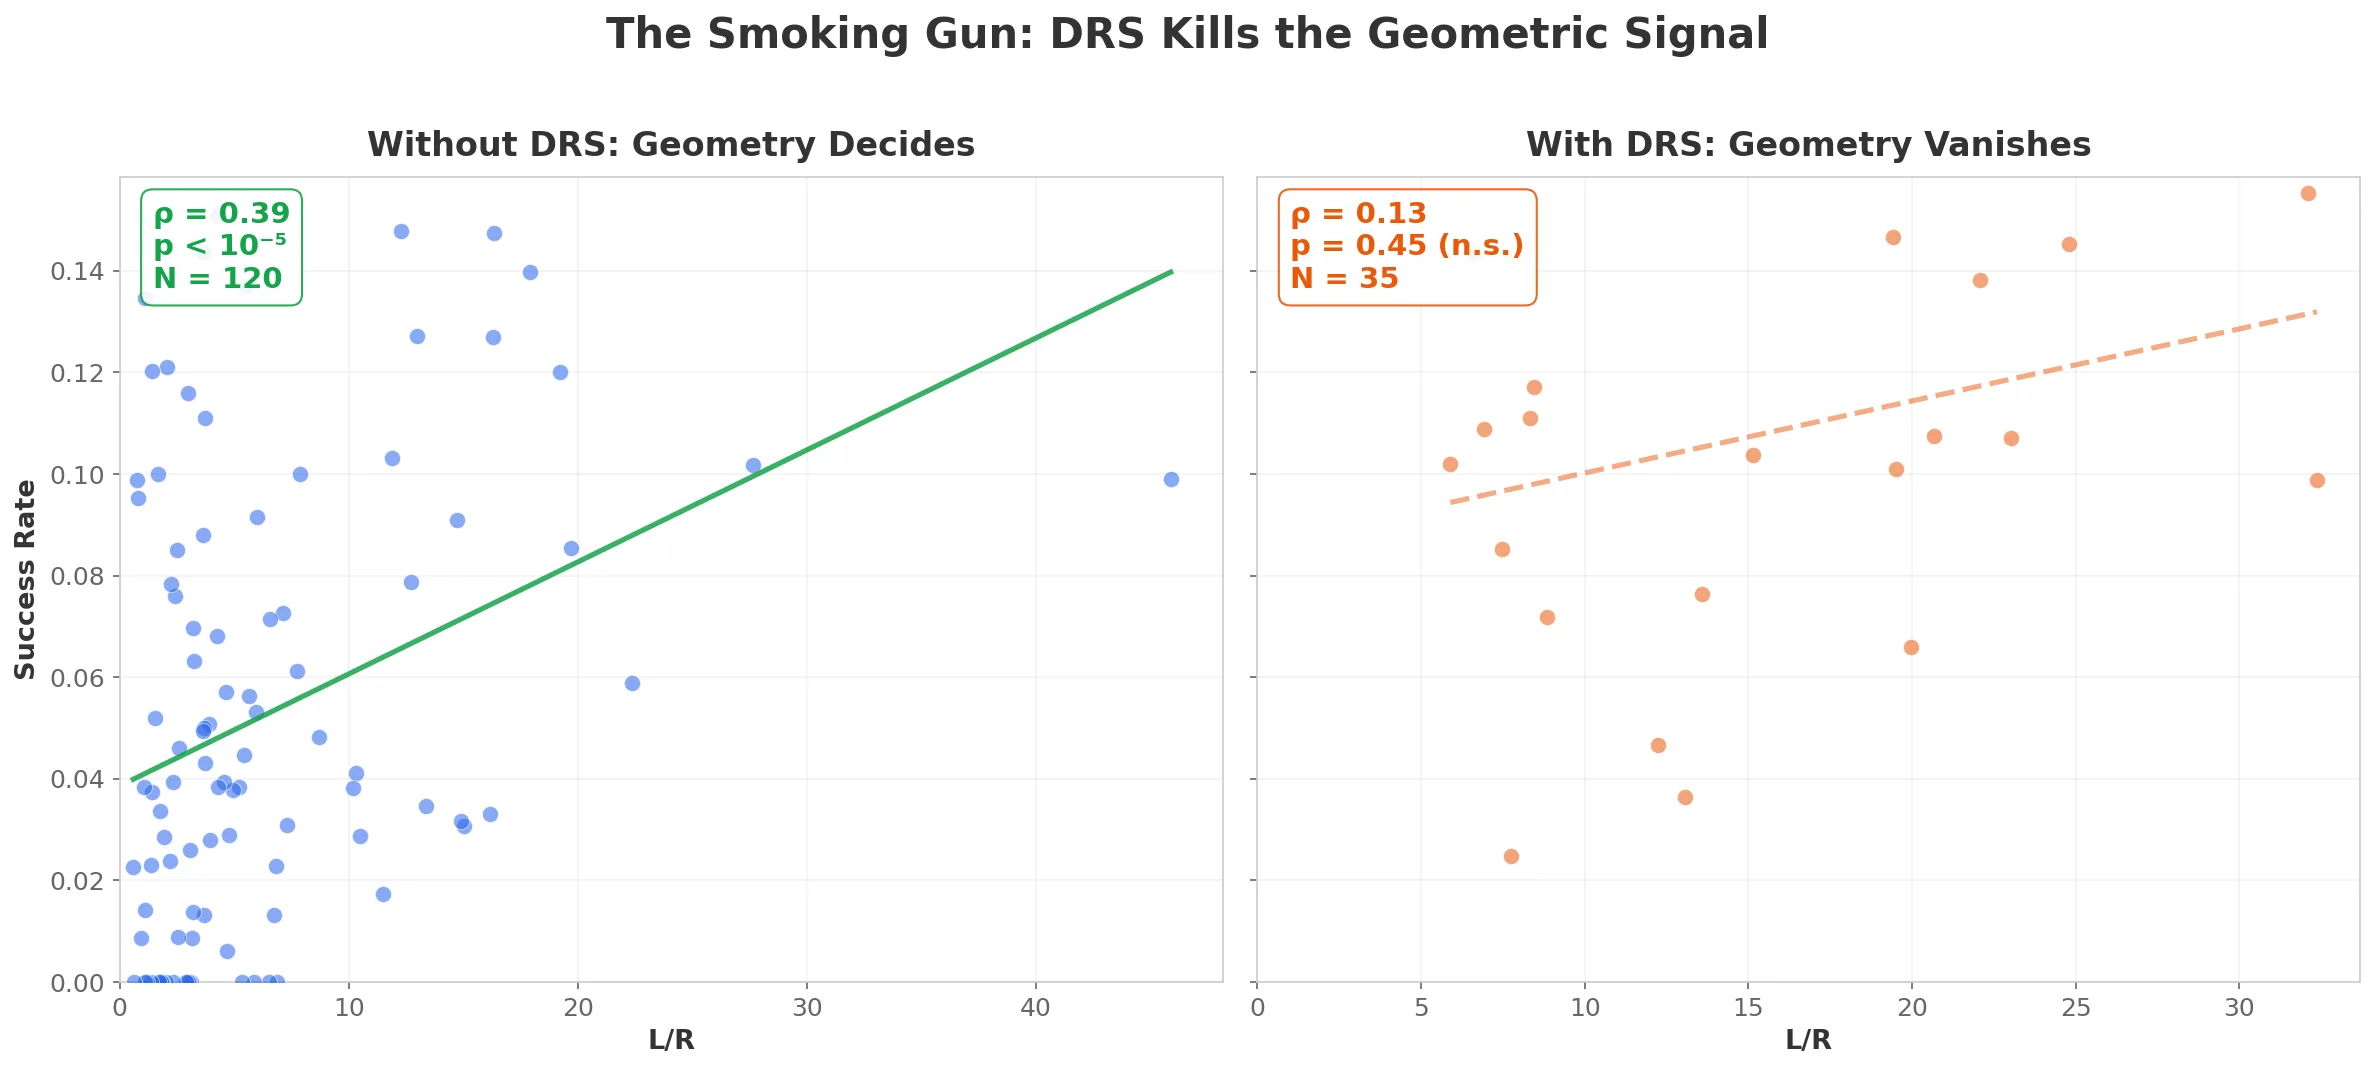
Same corners, same data, split by DRS. Left: without DRS, geometry decides- clear upward trend, strong correlation. Right: with DRS on, the trend vanishes. The artificial aid overwhelms the physics.
The mixed effects model tells the same story from a different angle. Across 247,813 close-following observations- with random intercepts for driver and circuit absorbing the variation that comes from Verstappen being Verstappen and Baku being Baku- DRS activation carries a coefficient of 1.75, increasing the odds of an overtake nearly sixfold on any given lap through any given zone. L/R has a coefficient of 0.06 per unit. Both are statistically significant, but the artificial aid is a far stronger per-event predictor. And yet L/R is the variable that explains where passes happen on the circuit. The tension is baked right in: DRS matters more for whether this pass succeeds right now, but geometry matters more for which corners produce passes at all.
A series dominated by grip-limit passing selects for drivers who can dance at the edge of physics. A series dominated by battery-management passing selects for drivers who can count kilowatt-hours. These produce different champions. And- not to be dramatic- but those are fundamentally different sports.
DRS was already a concession in this direction- the trailing car receiving drag reduction for free. But DRS demanded that the attacker earn proximity first: you had to get within one second through real driving, through surviving the dirty air, through being genuinely faster. The system rewarded aggression. Overtake Mode compounds the departure by drawing from a consumable budget- shifting the incentive from attack to conservation, from commitment to accounting. From “how brave are you” to “how full is your battery.” Cool. Great. Exactly what everyone wanted. (Nobody wanted this.)
Before 2026, real circuits clustered near the balance line. Under the new regulations, battery state injects a hidden variable that warps the competitive landscape in ways that shift lap to lap, corner to corner. The elegant geometry of attack and defense dissolves into noise.
The diagnosis is clear. The math also points toward a cure.
The Fix
The physics of overtaking is not broken. It is being bypassed. The DRS stratification is the smoking gun. A 13 km/h DRS boost was already enough to wash out the geometric signal. What do you think a 50 km/h battery differential does? It doesn’t just bypass the geometry. It erases it. Like- completely. Gone. The whole beautiful structure just disappears under that much artificial speed delta.
So what do we do? The same thing the math has been saying from the start. Bound the energy differentials. Keep them comparable to the old DRS effect- roughly 10 to 15 km/h, enough to enable, not enough to decide. Target L/R values between 20 and 50 in designated overtaking zones- the contested middle where the attacker’s speed buys proximity but not position- where the pass still has to be completed under braking. Calibrate circuit by circuit, corner by corner, exactly the way DRS zones were tuned for a decade. And restore the asymmetry- the attacking driver earns the advantage rather than simply deploying it.
The balance point is still out there. It always is- that is what the theorem guarantees. For every corner on every circuit, there exists a configuration where speed and geometry fight to a draw- where the driver who brakes later and commits harder gets rewarded instead of the driver who simply carried more energy down the straight.
This article is based on original research combining point-mass vehicle modeling, game theory, and empirical F1 data analysis. The empirical dataset comprises 1,971 overtakes and 803,140 close-following events across 121 corners on 16 circuits, extracted programmatically from FastF1 (F1 official timing data) spanning the 2022–2025 seasons. Circuit geometry is drawn from the TUMFTM racetrack database. The full technical paper, simulation code, and datasets are available here.